From the PF team: This is our first attempt at curating various studies and literature on search funds. We’d love to receive feedback and answer any questions — just hit reply on this email.
Introduction
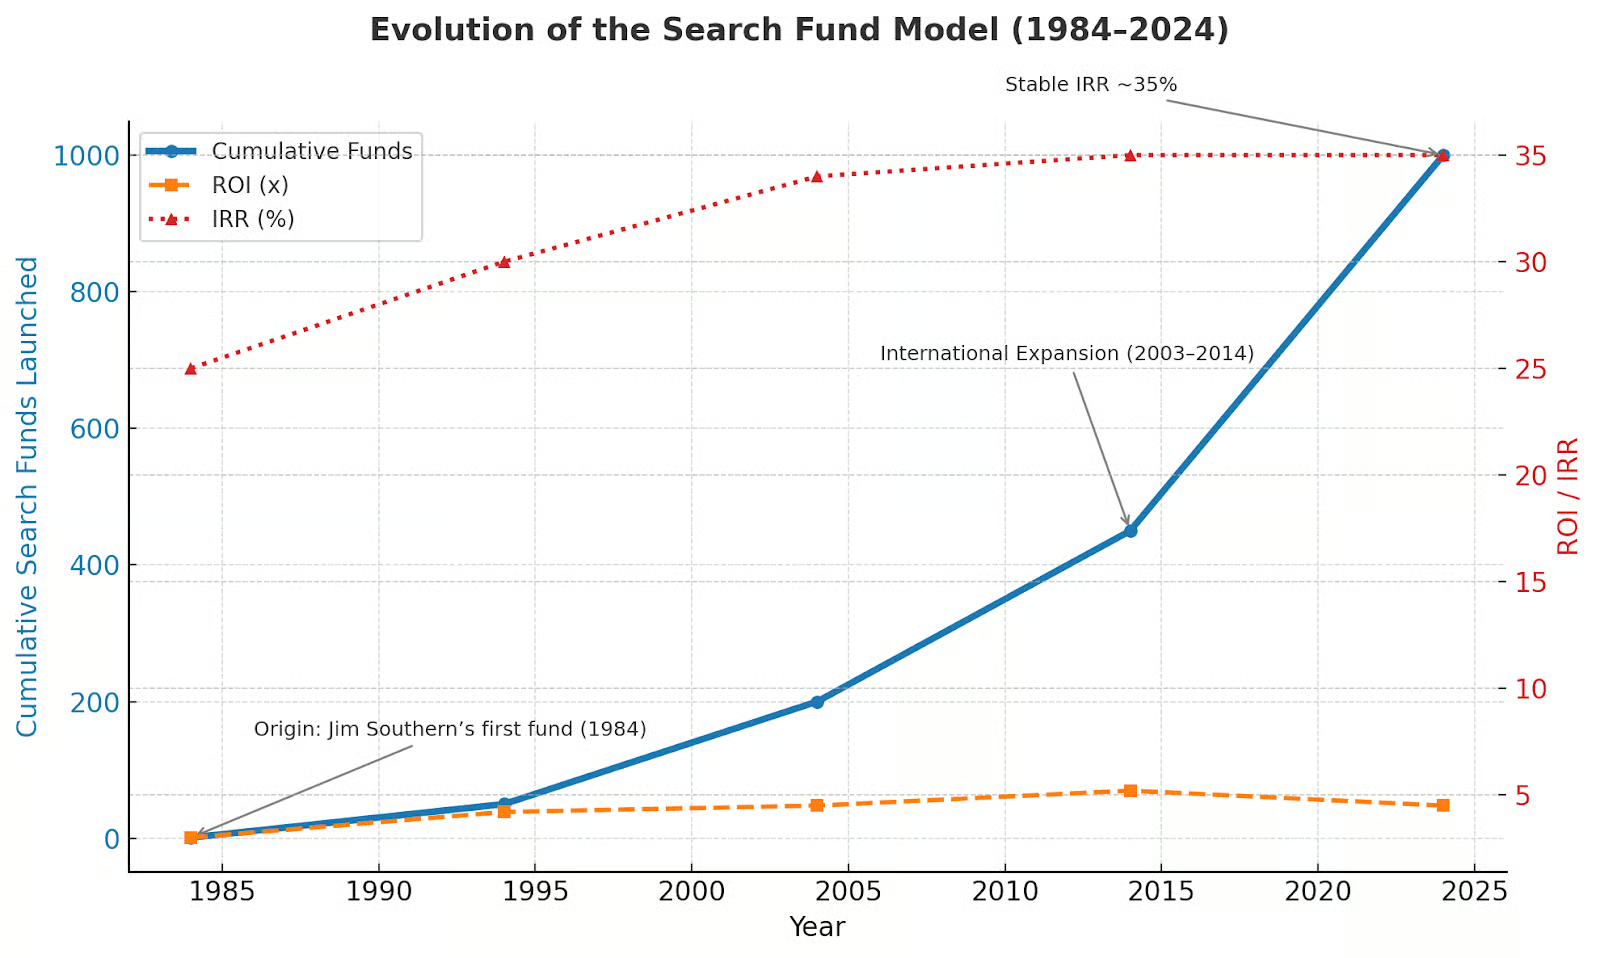
The search fund model was born in the early 1980s at Stanford GSB, designed as a vehicle for capable but inexperienced MBA graduates to become CEOs. One of the first deals under this model was Jim Southern raising a fund in 1984 and acquiring Uniform Printing — validating the model’s potential and launching what is now recognized as the first search fund, Nova Capital.
What began as a niche experiment has evolved into a distinct asset class and career path. Evolution has brought variations: institutional “core” searches, self-funded searches, and hybrid approaches emerging across continents. Each version represents a different balance of risk, ownership, and support.
Here, we trace that evolution — from the early days of search capital to the current wave of independent operators reshaping the lower middle market. For searchers, understanding this evolution isn’t historical trivia. It’s strategic context. The rules of the game are changing, and knowing how they changed is the first step in playing it well.
37% fail to find any deal. 63% of letters of intent fail after signature. The median search takes 20 months. This is not a shortcut — it is a discipline.
The Searcher: Profile, Pressure, and Performance
Who Are the Searchers?
The data on searcher demographics — median age 31–32, typically with an MBA and a background in finance or consulting — paints a clear picture of the résumé. The intangible qualities that correlate with success are often more telling.
Studies and investor feedback consistently point to three key traits. The first is perseverance — the search is a long, tiring, and emotionally stressful numbers game filled with rejection. The second is a specific kind of humility: successful searchers demonstrate a willingness to seek, and heed, criticism. Given that most are first-time CEOs, this ability to listen is critical. Finally, searchers need a high degree of flexibility and an aptitude for decision-making to navigate constant trade-offs and uncertainty.
The single biggest non-obvious mistake is often psychological. The search has a binary, highly emotional outcome, and the clock is always ticking. As a searcher runs out of time, he or she may feel pressured into a questionable deal — simply out of time pressure. Veterans flag this as the primary way good searchers close bad acquisitions.
Solo vs. Partnered?
The data presents a paradox. Partnered searches historically achieve 40.5% IRR versus 30.3% for solo searches — likely because a second view leads to better decisions. Yet 81% of new funds in 2022–2023 were solo.
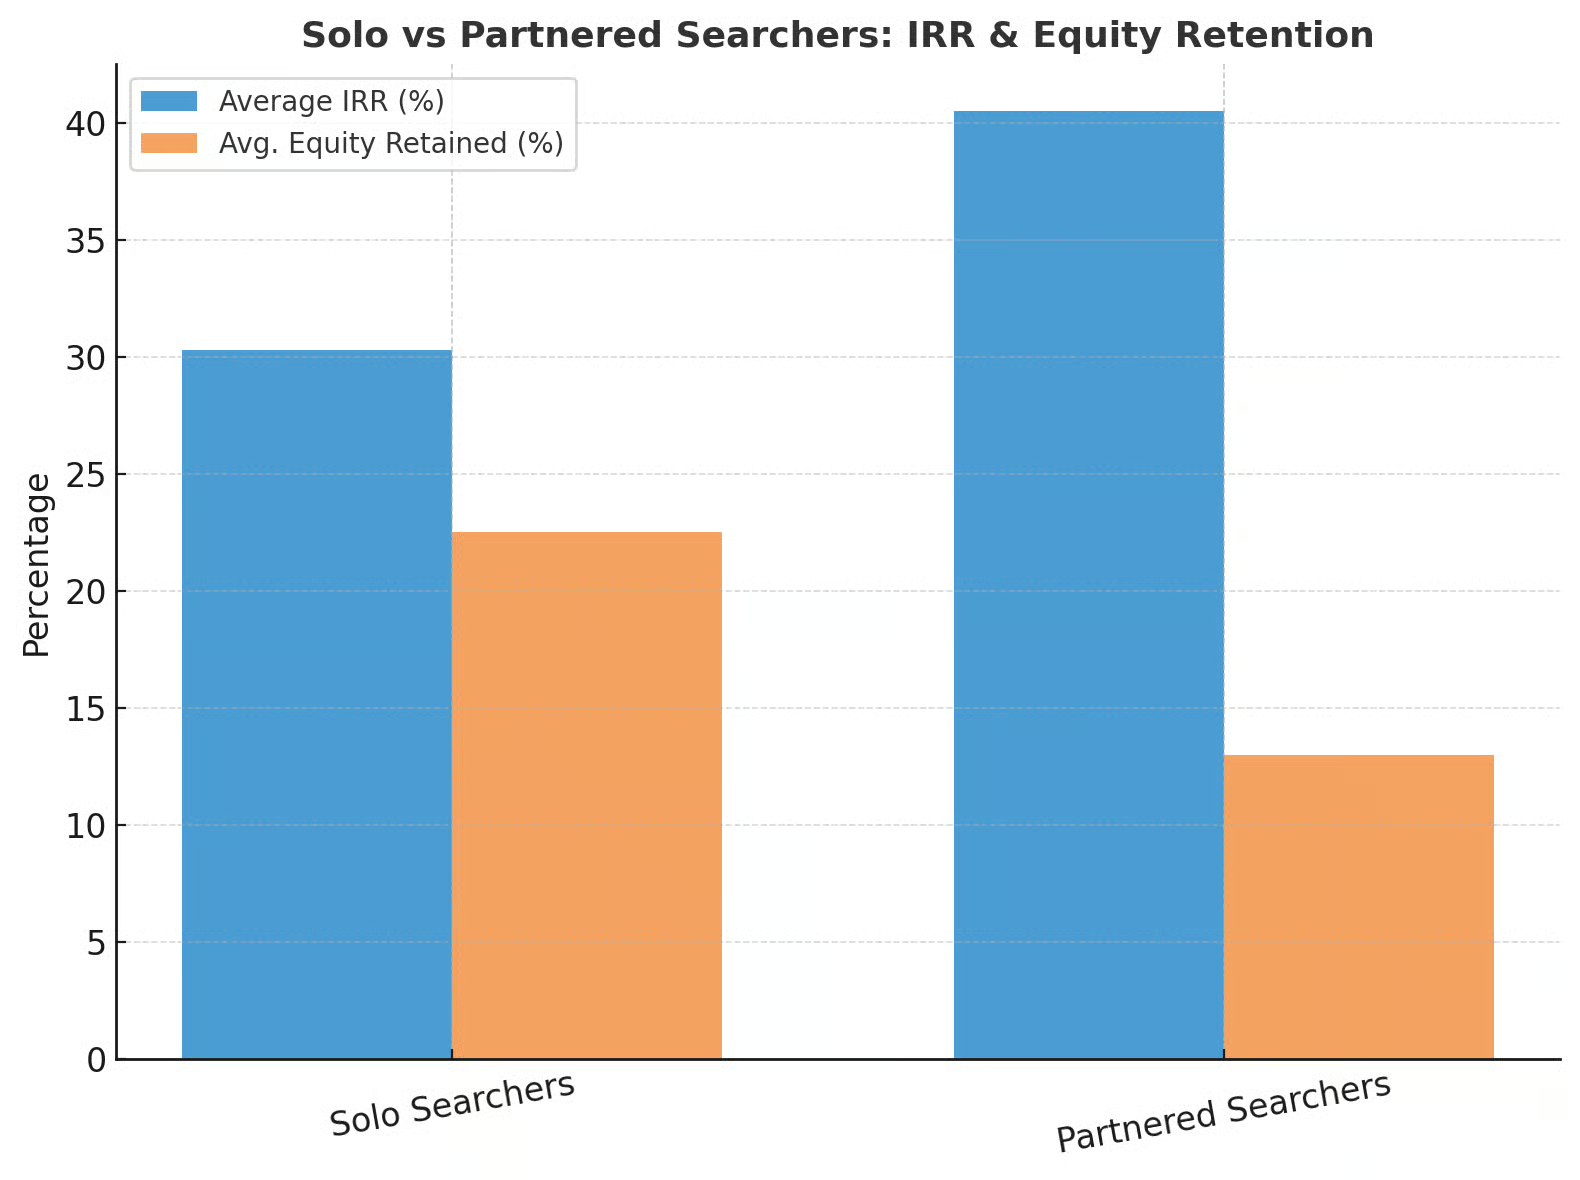
The decision is deeply personal. A solo searcher typically retains a 20–25% equity stake, whereas partners must share a combined 25–30%. Five of the six searchers achieving 10x+ ROI recently were solo operators — suggesting they are betting on variance over average returns.
In 1995, Kevin Taweel and Jim Ellis launched a partnered search and acquired Road Rescue, a Houston-based dispatch service, for approximately $8 million. They pivoted the company into the nascent market for cell phone insurance, renaming it Asurion. The result: the most successful search acquisition to date, valued at over a billion dollars. Other partnered funds, such as Headland Partners (D. Sellers and B. Godsey), have also generated outsized returns — exiting their acquisition at an 11x investor return.
So why do so many searchers go solo? The 81% that go solo are making a rational bet on variance over the mean — accepting a lower probability of success in exchange for a 100% claim on the entire prize.
International vs. North America: Explaining the Gap
There is a striking difference in international acquisition success rates (79% vs. 63% in the US/Canada). The primary hypothesis is market maturity. International markets are younger, with the model expanding to many countries only after 2003 — suggesting a larger, less-picked-over supply of available businesses with less competition.
The 2019 acquisition of OKM detectors in Germany illustrates this. Stephan Grund, a business-school graduate and former strategy consultant, launched a search in Germany and successfully acquired OKM, a leading SME manufacturing metal detectors. Between 2018 and 2022, Germany had over half a million SMEs seeking successors, and Finland had over 78,000 owners set to retire — markets wide open for prepared searchers.
The Target: Sourcing, Selection, and Valuation
What a “Good Horse” Looks Like
The definition of a “good horse” remains remarkably consistent. The criteria from the seminal 2014 IESE report — a history of profitability, high recurring revenue, low CapEx requirements, and operating in a growing, fragmented industry — are still the ideal. These criteria are aimed at reducing risk for a first-time CEO.
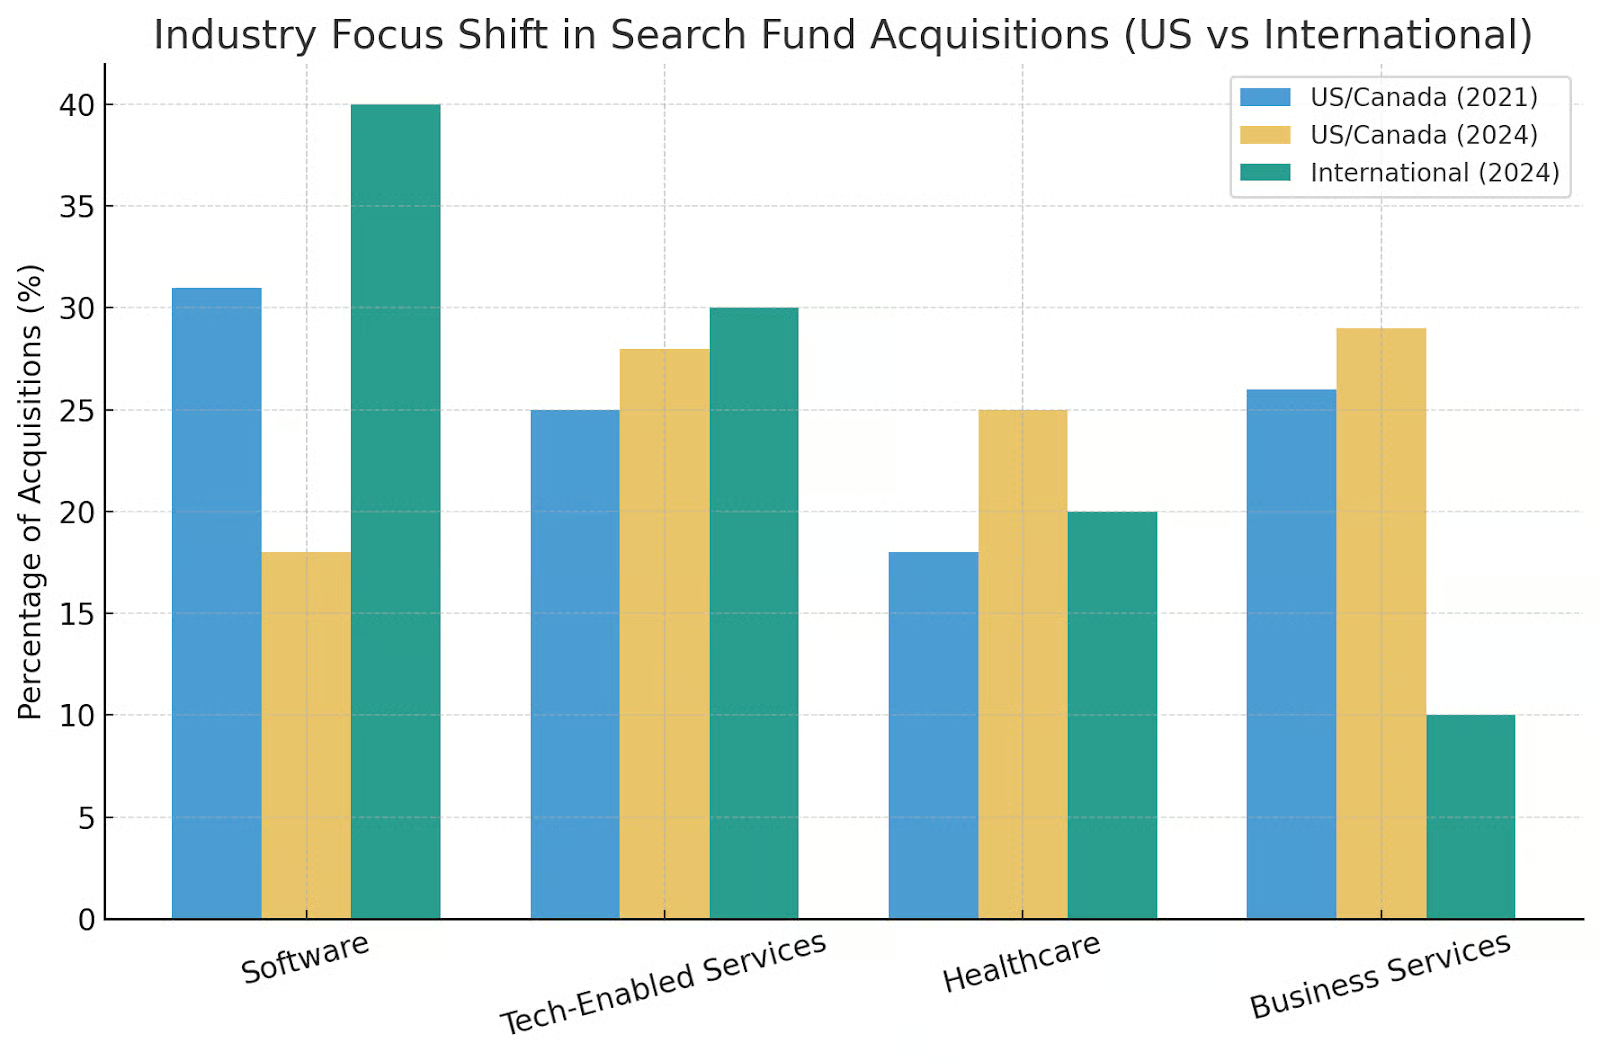
The rise of software and tech-enabled services has not changed this definition; rather, these industries often fit the criteria perfectly, which explains their popularity. Recent data from the 2024 Stanford study indicates a slight moderation in pure software, with continued strong focus on tech-enabled services, healthcare services, and other business services.
Explaining the Multiple Gap
The core model targets larger deals with a median purchase price of $14.4 million at 7.0x EBITDA, operating in a more competitive deal environment where private equity firms and strategic buyers drive prices higher.
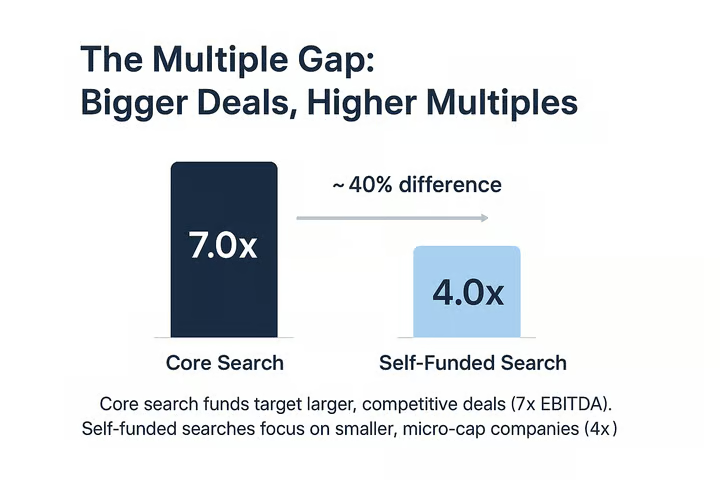
The self-funded model, by contrast, targets the micro-cap segment — typically companies with $500K to $2M in EBITDA. This market is generally too small for traditional PE, creating a less competitive environment where 3.0x–5.0x multiples are the norm.
Chenmark Capital, founded by Trish and James Higgins, is a premier real-world example. Chenmark acquires small, non-glamorous, cash-flowing travel businesses — seasonal operations too small for institutional PE that fit perfectly within the self-funded target range. These are precisely the types of businesses (home services, commercial maintenance) that trade at 3x–5x multiples.
How Are Searchers Sourcing Their Deals?
Proprietary sourcing is often the make-or-break factor. The 2024 IESE study identifies “Proprietary Exploration” as the most common deal sourcing approach, used by 64% of searchers. Its importance lies in finding businesses not actively for sale — less competitive bidding, lower prices.
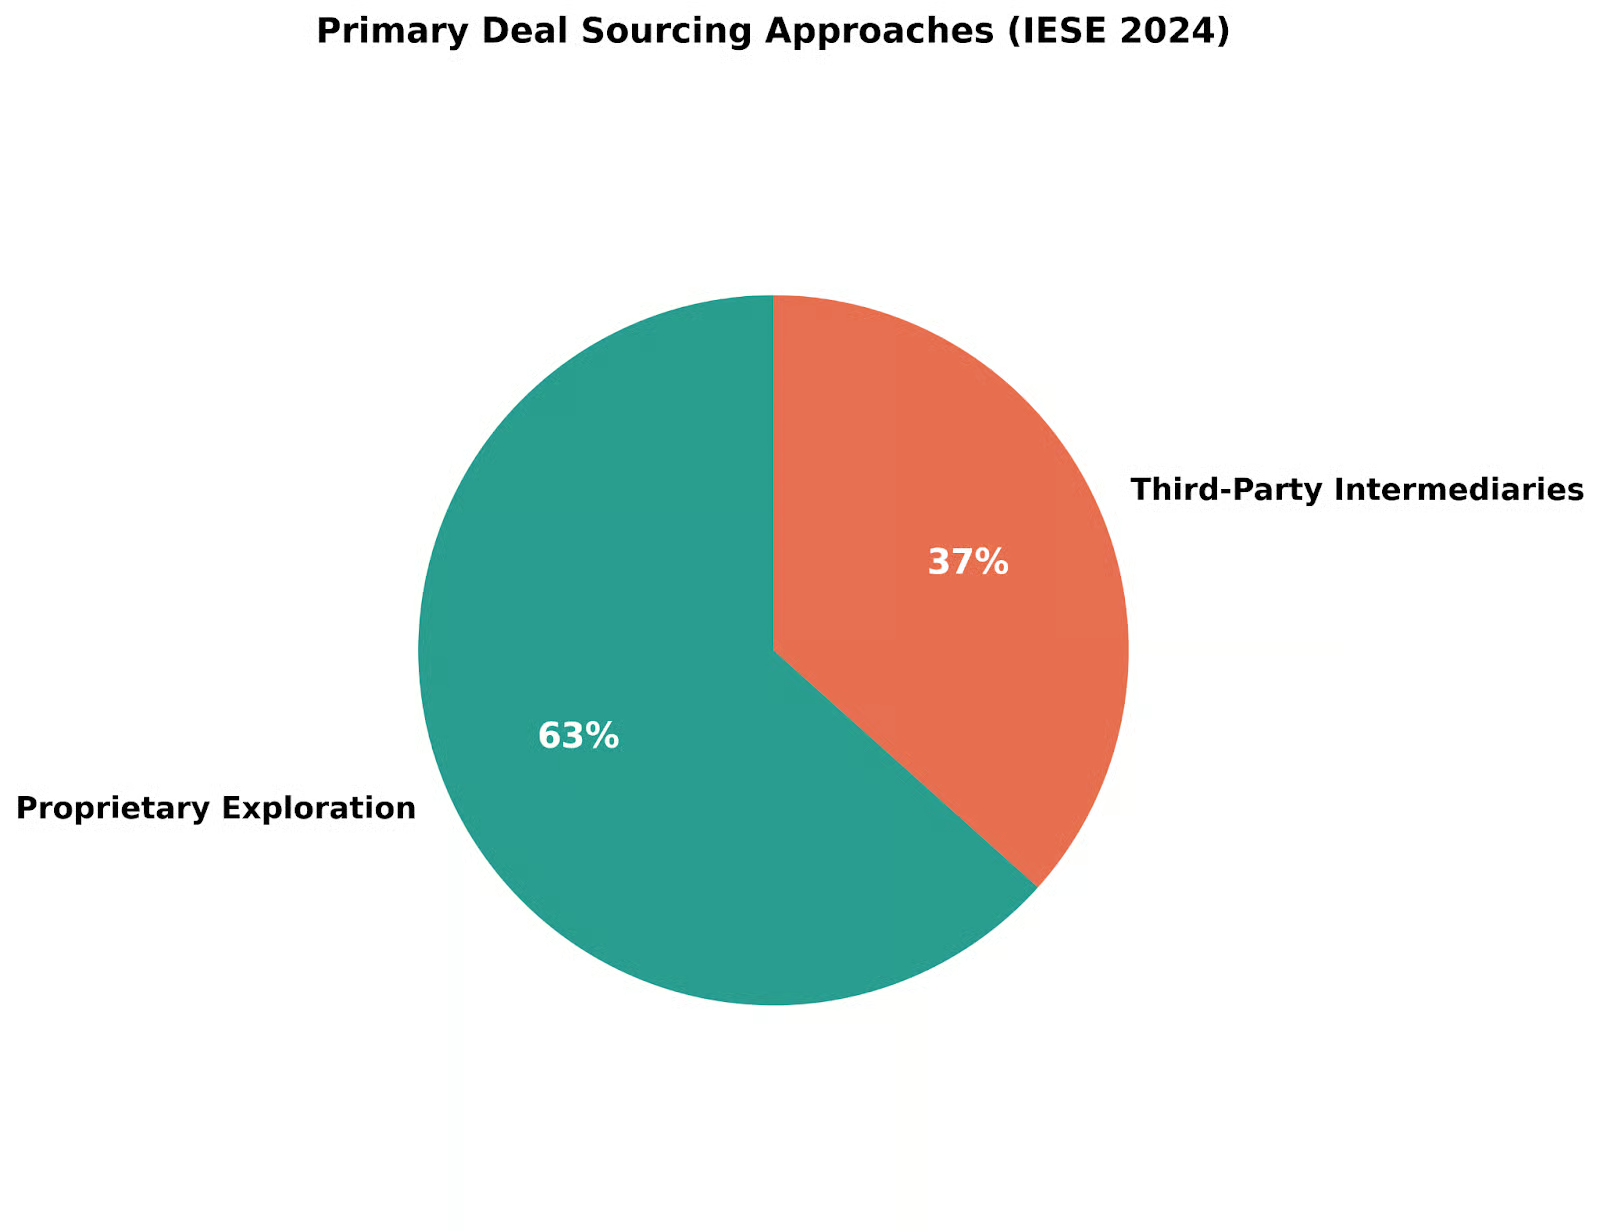
Advanced proprietary methods include conducting deep industry research, attending trade shows to gain credibility, and engaging “River Guides” — typically retired industry CEOs or trade association presidents compensated to provide warm introductions to potential sellers. A highly effective way to establish credibility before any conversation begins.
The Deal: Due Diligence, Negotiation, and Failure
Why Do Deals Fail Post-LOI?
The period between signing an LOI and closing is arguably the most critical. The 2024 IESE study identifies the top reasons: problems discovered during due diligence (63%) and valuation issues (48%). These two findings are directly linked — they describe the most common and predictable crisis point in any deal.
A searcher signs an LOI based on a seller’s represented $1.5M EBITDA. The commissioned QoE report returns an adjusted EBITDA of $1.1M. The tactical playbook: do not view this as a failure — view it as the process working correctly. Frame the QoE as objective third-party validation that both sides need. The conversation is then straightforward: the initial offer was based on $1.5M in earnings; the verified number of $1.1M requires a proportional adjustment. It needs to be a renegotiation, not an accusation.

How to Handle Seller Considerations
Seller retraction accounts for 38% of post-LOI failures. This statistic proves that a searcher is acquiring a business from a person, not just a set of financials. For many owners, this is an emotional process of selling not just the business, but their life’s work — decades of effort and identity. If the seller does not believe you can genuinely take their business forward, no offer will close the deal.
From the first meeting, work to understand the seller’s true motivations. Are they genuinely ready for retirement? Solving for legacy outcomes? A seller who is just “seeing what offers they get” is a significant waste of time and energy. Building trust and maintaining open, constructive communication is the only way to keep a seller committed through a long, difficult acquisition process.
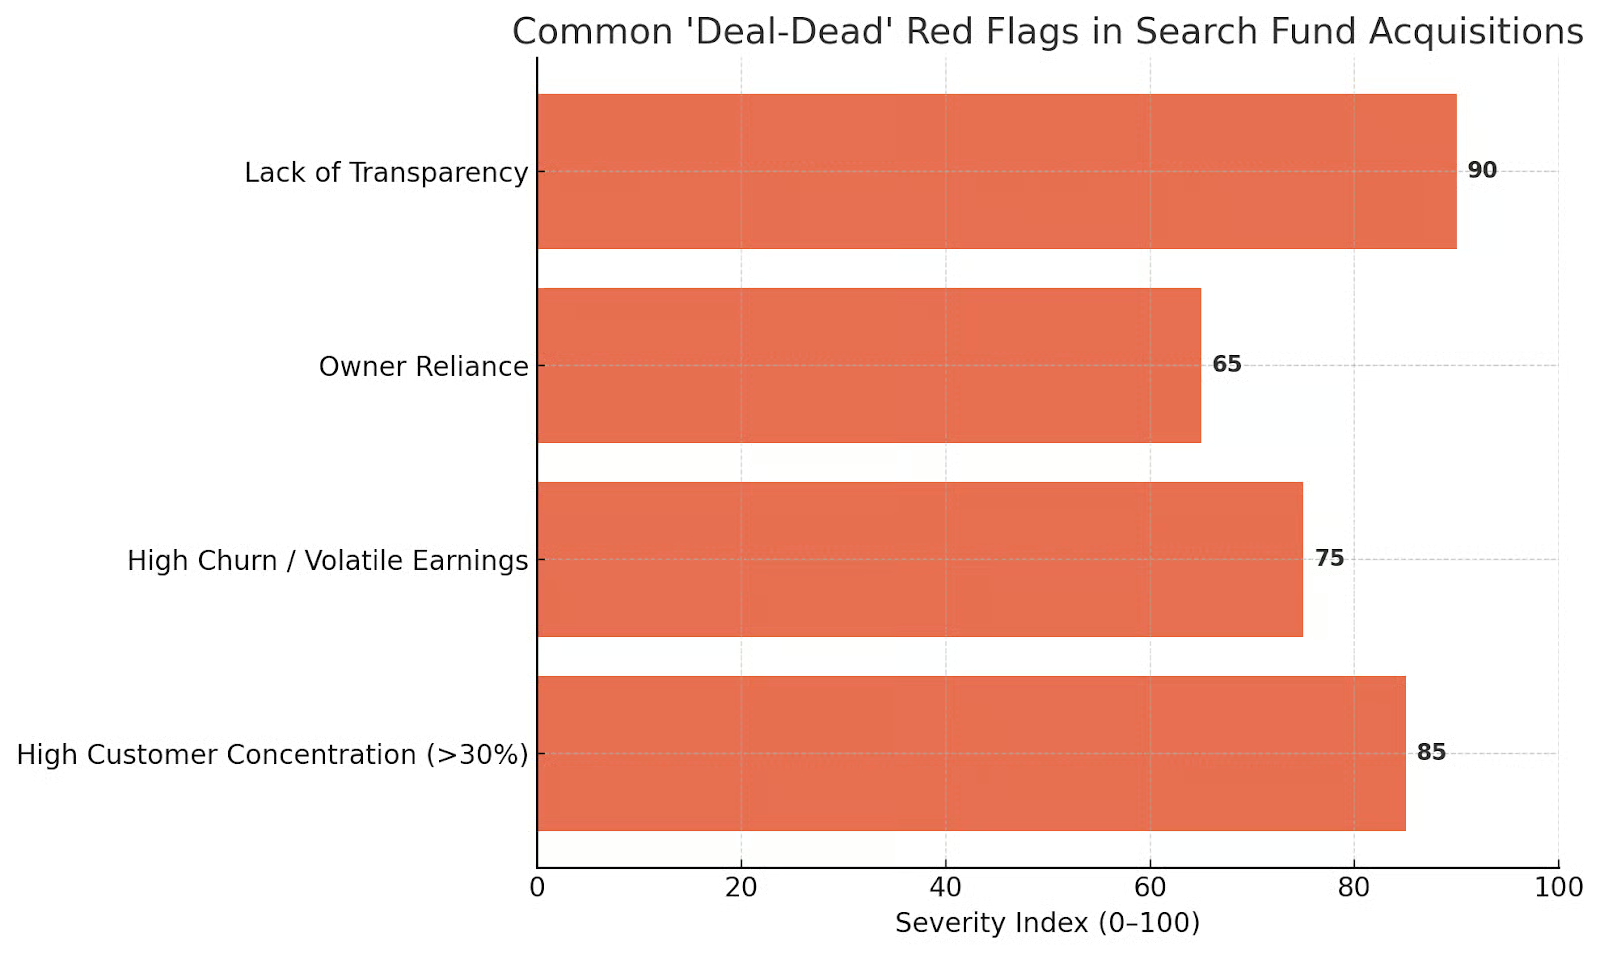
When to Walk Away
- Turnaround situations — searchers need stable, profitable companies, not broken ones
- High customer concentration — one customer accounting for over 30% of sales
- High churn or volatile earnings with no forward visibility
- Seller lacks transparency or obstructs diligence — the biggest red flag of all, indicating a critical lack of trust and likely a fatal, unfixable flaw
The Exit and Final Reflections
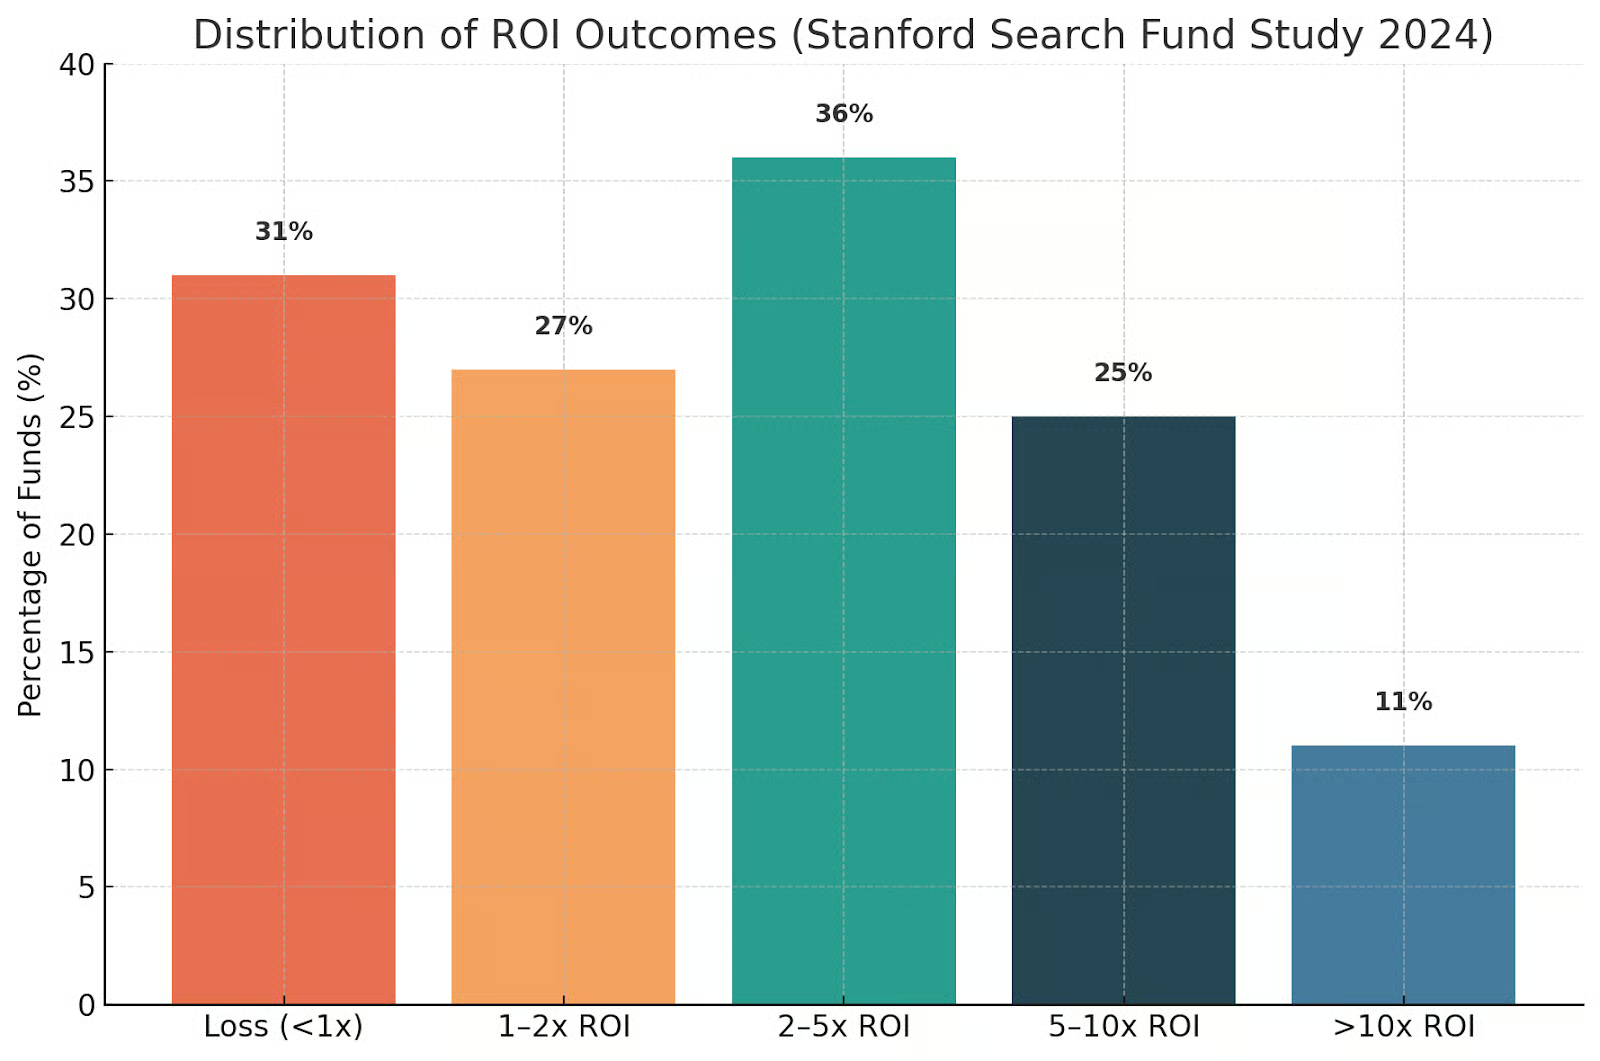
The 2024 Stanford data shows a barbell distribution. 11% of acquisitions achieve a grand-slam greater than 10x ROI, while 31% result in losses. Quality of asset is what separates them. Losses are almost always linked to acquiring turnaround situations, businesses with high customer concentration, or those in volatile, unpredictable industries.
The choice between core and self-funded is a direct and personal trade-off between risk and reward. The core model offers a median exited payout of $2.25M with significantly lower personal risk — the searcher receives a salary during the search and investors bear the financial risk of failure.
The self-funded path is a high-risk, high-reward bet on oneself. The searcher forgoes a salary and puts themselves at risk of personal bankruptcy. The explicit return for taking on this risk is retaining a substantial majority — usually 60%+ of the equity.
The best advice is to make this deeply personal choice based on an honest assessment of your financial cushion and psychological tolerance for high-stakes, personal liability.
Bibliography
- Benjamin, Elad, et al. Search Fund Primer. Stanford GSB, May 2021.
- Harvard Business Review. How Search Funds Are Redefining Entrepreneurship. HBR, 2019.
- Hurst, A., & Pickenpack, L. Foundational Guide to Self-Funded Search Funds. Searchfunder.com, 2021.
- Kowalewski, Ann-Sophie, et al. International Search Fund Study 2024. IESE Business School, Sept. 2024.
- Kolarova, Lenka, et al. IESE Search Fund Study 2022. IESE Business School, Oct. 2022.
- Leung, Yannie, and Christina Stiles. Entrepreneurship through Acquisition – A Scoping Review. Harvard Business School, 2022.
- Ruback, Richard S., and Royce Yudkoff. Search Funds — What Has Made Them Work? IESE Business School, 2016.
- Stanford Graduate School of Business. 2024 Search Fund Study: Selected Observations. Center for Entrepreneurial Studies, 2024.